
THE HIDDEN BEAUTY OF DATA
by Fatin Najihah on Mar 13, 2023
Each work of art is unique. There’s only one original art piece, created in a specific moment in time. It has a different story to why it came about. There’s only one Guernica; there’s only one Sistine Chapel. The most perfect forgery can’t match an original. As a result, any copy is a reproduction.
Just like work of arts, each one of us is unique, too. We have different features, different personalities, different colors, different lifestyles, and different rhythms.
So, what if we could visualize the singularity of our bodies as a unique work of art?
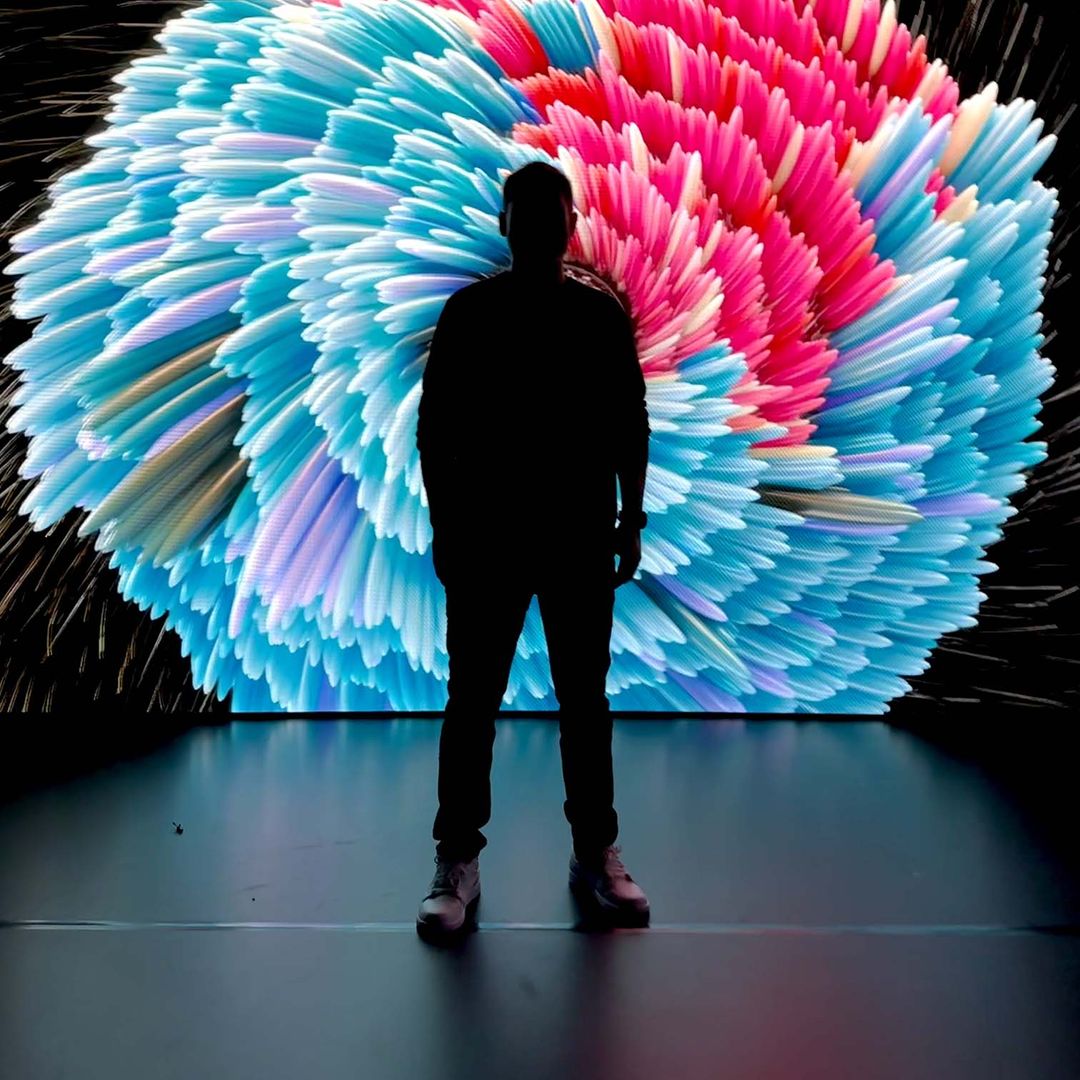
When we launched Polar Ignite 3, we decided to try a little experiment. We wanted to create a work of art that would visualize the uniqueness of every heartbeat, every step we take, every minute we spend asleep. Just like an art piece, every body is unique and tells a story of who we are as individual. Every body has its own rhythm that we can quantify by measuring our daily activity and sleep. Could we use this data to create a work of art?
We teamed up with Dr. Kirell Benzi, a renowned data artist, and researcher, to reveal the hidden beauty of all the data Polar Ignite 3 captures. Together with Racecar, a high-end motion graphics studio based in Norway, they discovered a beautiful manner to visualize our unique individual rhythms.
Let’s see how they did it.
First, during the launch of Polar Ignite 3, I asked Dr. Benzi about his approach to data art and this project. “With these artworks I wanted to add emotion to the data the watch measures and captures. We can visualize it and carry a message through charts and graphs, but data, by itself, rarely evokes an emotional response,” explains Dr. Benzi. “By using data as a medium to create art, we not only transmit a more objective message, not strictly based on the artist’s personal interpretation, but also bring some emotions.”
Working together with Dr. Benzi, we wanted to visualize the data of three very different people to understand how complex and unique our individual rhythms can be.
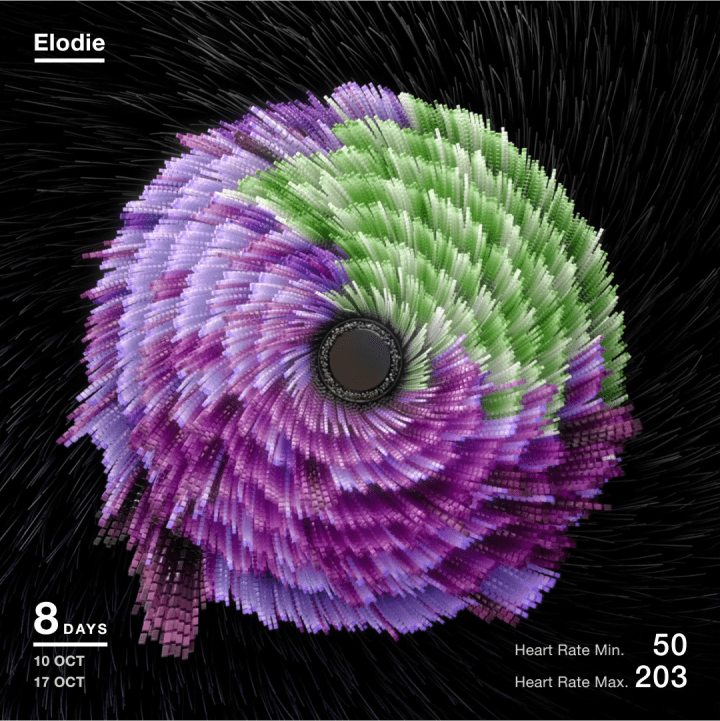
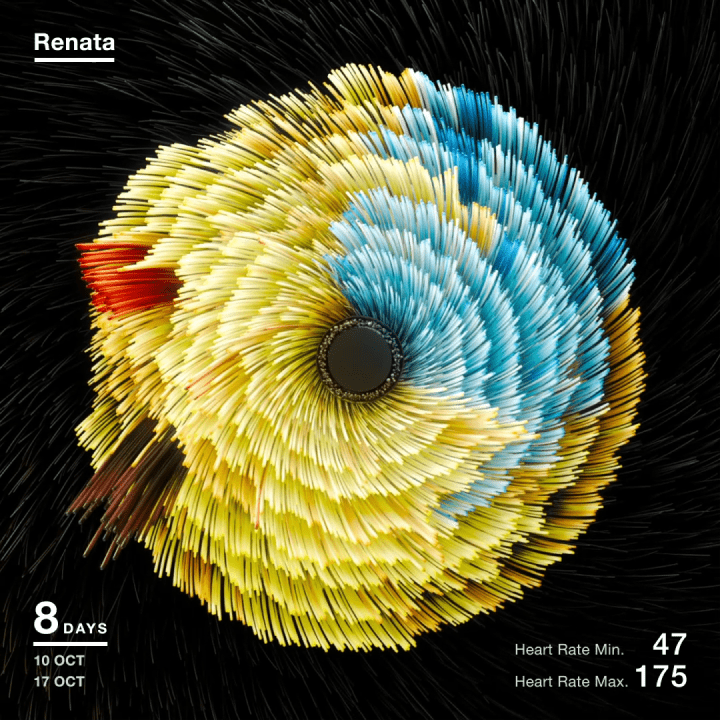
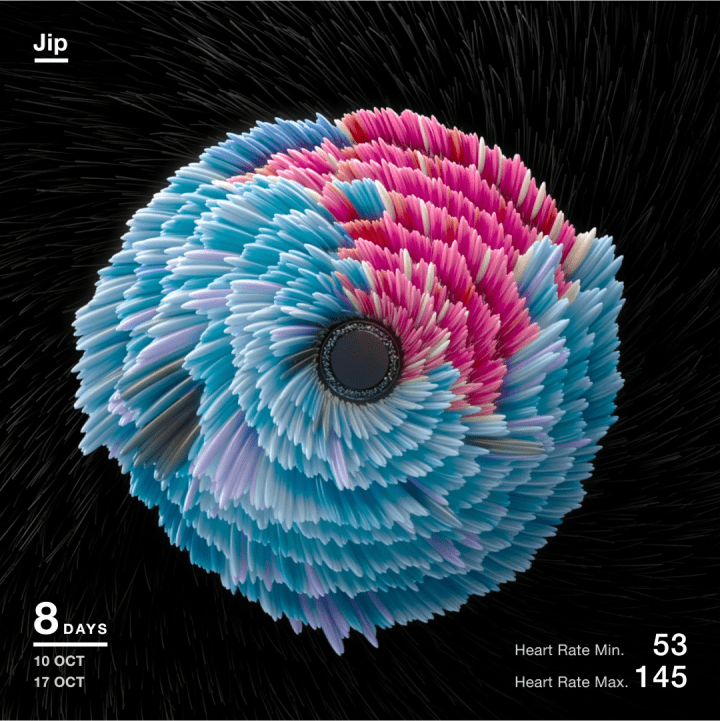
These three individuals come from very different backgrounds: 1) Jip, a pilot who travels the world, 2) Renata, a Polar employee with a typical 9 to 5 job, and 3) Elodie, an agriculturist who spends her days out and about. Their lifestyles are poles apart.
The three of them wore their Polar watches day and night to track all their activity, workouts, and sleep. The watch captured every beat of their heart, their daily step count and calorie consumption, their wake and bedtimes, how much they sleep and how much time they spent in each sleep stage. Everything they did produced data. After eight days, Dr. Benzi had a tremendous amount of data points (more than 2 million) that would soon be transformed into three unique art pieces.
The first step was to make sense of the data. “We developed a method to process it and reveal the most significant data points and patterns. We also interviewed the three participants to add some qualitative information,” observes Dr. Benzi.
A PERFECT CIRCLE
Once the data was ready, Dr. Benzi thought of the form the artwork would take. The answer was clear: a circle.
Our body’s rhythm is typically a 24-hour cycle governed by light and darkness. It’s what we call the circadian rhythm. Nothing represents this cycle better than a circle. Plus, the circle also matches the curved aesthetics of Polar Ignite 3.
One side of the circle would visualize the hours of sleep and the other side would show the daily activity. After many iterations and sleepless nights, the final data visualization model was ready, with a distinct divergent color palette for each piece, highlighting daytime and night cycles. The intensity of the colors also helps interpret the data. For example, lighter colors during night highlight moments of wakefulness, and darker colors indicate peaks of activity, like a workout.
Below you can see the artworks created by Dr. Benzi and Racecar to visualize the lifestyles and rhythms of Elodie, Renata, and Jim.
EVERY BODY IS A WORK OF ART
“Science can appear very opaque. I hope to show that through data art, emotion and logic work together to communicate science better,” says Dr. Benzi.
These works of art show the uniqueness of our lifestyles, our bodies, and our rhythms. They show that every body is a work of art.
By revealing the singularity of each body, we understand of the important of personalized guidance based on our body’s condition. In other words, to perform better in sports and in life, you must find your rhythm.
Read Dr. Kirell Benzi’s manifesto to find out more about data art at www.kirellbenzi.com/data-art-manifesto
If you liked this post, don’t forget to share so that others can find it, too.


